Wine Market Liquidity Indicator or Squaring the Infinite Circle
As the title suggests, calculating a liquidity indicator for the fine wine market is an impossible task. The benefits of having one are clear as it helps a quantitatively minded portfolio manager with a multitude of tasks – from creating and maintaining indices for market benchmarks to portfolio creation and rebalancing. Yet, the realities of the market are such that none of the quantities we expect to be able to measure to come up with something that would satisfy potential critics are available. We do it anyway, but to use the result of that calculation and understand its limitations, we will look at all its shortcomings and try to understand why we choose to go down this specific calculation route. As always, the devil is in the details.
The general definition of market liquidity states that it is the extent to which the market allows the asset to be bought and sold at stable, transparent prices. Transparent is the key word here – the fine wine market is anything but transparent. The majority of deals are done behind the scenes and are never reported anywhere. These can be negociants to merchants and merchants to private/institutional investor transactions, individual producers to negociants or direct to investors/consumers and deals between private investors. Information about none of these is made available for the rest of the market to analyse.
Even in cases when merchants sell directly to the public and publish their prices online, we found plenty of examples where stale and unreliable prices persist as, in many cases, they are subject to the final confirmation and, as such, provide little incentive for the merchant to keep them up to date.
When it comes to price lists exchanged between merchants, these are generally not shared outside of the tight circle of existing clients and, as a result, don’t get seen anywhere, even on platforms like Liv-ex and Wine-Searcher. These are also subject to final negotiation anyway, and there is no obligation on either party to the trade to report these anywhere.
Even producer sales are not public, in many cases even production levels and release quantities are being kept secret, so even an attempt to estimate the asset scarcity in that direct way is going to be futile.
There are some limited bright spots, of course. There is a whole class of emerging platforms that offer "exchange-like" wine trading, showing both bids and offers. Some information can also be gleaned from Liv-ex, which does have some bids and offers and publishes the level and date of the last trade. These, however, are few and far between, and each one captures only a small fraction of the existing market at this stage.
Going the roundabout way
We can't tackle the problem head-on; there simply isn't enough data available, so we need to try and go the roundabout way. We are privileged to have both Wine-Searcher and Liv-ex data at our disposal. Wine-Searcher is a collection of merchant prices offered to the general public, which can include both other merchants and private investors. These are generally available in price lists on the individual merchants' websites, with some exceptions when they submit their prices to Wine-Searcher directly.
Wine-Searcher offers an unparalleled view of market depths, taking into account perhaps the largest slice of prices available in the market. However, it comes with limitations, some of which are directly related to the structural problems of this market. Some prices can be stale and incorrect, as mentioned above, so we need to be able to detect and remove outliers. There is no depths indication – we only know that a specific format is available from a particular merchant with no quantity indication. There is also the problem of brokering activity.
Essentially, in order to offer the wine to the public, the merchant doesn't have to have it in stock. It's enough for them to see an offer on Liv-ex, and many automatically create a related offer with a margin added on top. This leads to a single case potentially available in the market appearing as offers from five or six different merchants – all at slightly different prices. If the client attempts to buy that wine – the merchant will buy it via Liv-ex, but if it turns out to be unavailable – they just notify the client, and the transaction doesn't go ahead. This process can sometimes take time, which creates a time lag. One can only hope that this affects all wines in more or less the same way, so we can still make comparisons between the wines and develop a relative measure.
In Bond vs Ex Tax vs With Tax, format differences
Generally, the investment market in wines trades in bond as this offers tax advantages both at the point of purchase and trade exit. As a result, it makes sense to assign much higher weight to offers in that format. This does come with a caveat – many European merchants publish their prices with and without (excluding) tax. In some cases, these are, in reality, available in bond; in some cases, they are not. It all depends on where the stock is located.
On top of that, additional considerations are involved, particularly from the standpoint of private investors, as they don't have the economy of scale when it comes to deliveries from warehouses in other countries. These can add friction to potential trades, so it makes sense to discount these when trying to assess the liquidity.
Format considerations are equally important. We tend to prioritise case formats over single bottles as the bulk of the investment market is concerned with the former (with some exceptions, particularly when it comes to non-standard bottle sizes and top producers in Burgundy and Champagne). The latter pricing tends to be more prone to outliers and special considerations affecting the price and availability.
The elephant in the room: Offer side and depths considerations
We have been skirting around the issue, but this is a big one, so no liquidity discussion can happen without addressing it. Almost the entire visible wine market is made up of offers for sale, with a small number of exceptions, as mentioned above. The majority of market participants, for now, don't take advantage of the platforms offering them the chance to place bids. Partly, the reason is historical; this is how this market operated for decades if not centuries; partly, it is because the marketplaces offering the chance to place bids are not established enough and don't facilitate enough trading volumes to make it a worthwhile exercise.
The bids generally tend to be opportunistic at low levels, hoping to attract uninformed or desperate sellers, and, for now, cannot be seriously considered in either determining the market price or market liquidity. There is a strong argument to be made that this situation is about to change; however, we are not there yet.
Not all offers are created equal. When we look at the offer side – we have no idea of the size behind them, and also, some of them come in at such wild levels that their contribution to market liquidity is highly questionable. Some of them can be many multiples above or below where the bulk of the market participants are quoting their prices.
In some cases, this reflects the geographical peculiarities of specific markets; in some – it has to do with the eponymous fat finger effect. Whatever the reason – ideally, these should be discounted both for price calculations and for liquidity estimates. Currently, we only go as far as cleaning the most obvious outliers, but with time and increased information flow, it might make sense to start making additional adjustments here.
Enough with the problems, let’s talk method
Hopefully, you get the sense of what we are up against yet still have the will to fight on. It is time to look at the actual methodology behind what we call the "liquidity indicator" at Cult Wines.
Please remember – the final number in itself is meaningless; the purpose here is to have a comparative descriptor which allows us to look at two wines and, in the absence of any other considerations pushing us towards one of them and not the other and decide which one would be a better choice for our investment portfolio.
There is no need to try and compare the liquidity of wines from different regions as this is taken care of by our regional composition constraints anyway, so we split the universe of wines we are considering into seven distinct regions – Burgundy, Bordeaux, Champagne, Italy, Rhone, US, and Rest of the World. These align with our tactical allocation preferences and the Cult Wines indices. We then calculate two indicators. One is based on Wine-Searcher data, and one is based on a standard Liv-ex feed.
Let's start with the former as it is a more important one. As discussed, we are considering the depths of the offer. Even though we don't have any information about the size of each individual merchant offering, the number of merchants quoting prices can be seen as a good indicator behind the activity levels in this particular wine.
We trust that the majority of the merchants involved are acting in their best interest and are acquiring wines they know they have a good chance of selling to their customers. Their business depends on it, after all.
We remove the outliers and quotes from merchants, who we suspect predominantly act as brokers, as part of our price calculation process and then assign a high score to all prices in the remaining list quoted in bond. The remaining prices receive a smaller score, and then the prices from the merchants we cut are added back with an even smaller score.
These are summed for each wine/vintage combination (lwin11 if you are used to Liv-ex ID system), and the resulting score is then ranked within each region. These rankings are then normalised to run from 1 to 100 for a more detailed indicator and further to run from 1 to 5 for the basic indicator we use for most practical applications. As a rule of thumb, 5 means the highest number of high-quality pricing points and, therefore, the highest liquidity and 1 is the lowest liquidity.
When Wine-Searcher data is unavailable, we can sometimes fall back to Liv-ex data and calculate an equivalent indicator. Here, we consider the date of last reported trade, the date of market price and the reported average list quantity, all within specific region as with Wine-Searcher. All three are ranked, rebased to 1 to 10 and then added together before being rebased back to 1 to 5. As with the Wine-Searcher indicator, 5 is the most liquid, and 1 is the least liquid.
Strictly speaking, the two indicators are not directly comparable, and, in fact, the Liv-ex indicator has more to do with liquidity in its original definition we started with, since it is trying to look at the frequency of trading. However, it is still possible to make meaningful comparisons, and one can certainly expect them to show results that are broadly in line.

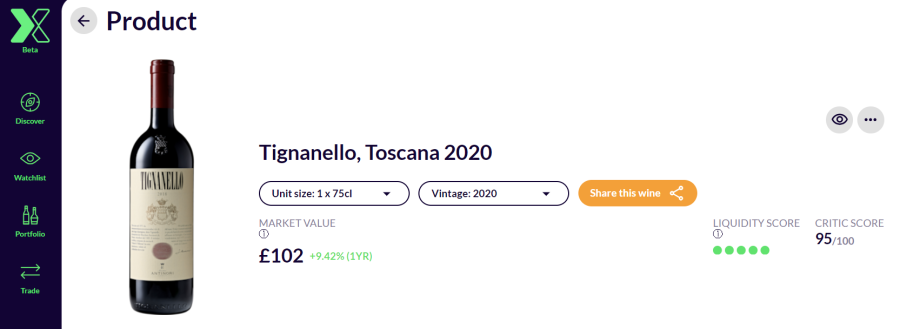
CultX puts your wine portfolio in your hands with live data and expert insights. Get everything you need to build, track, and manage your fine wine portfolio directly in our app.

Related Articles