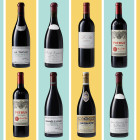
Cult Wines H1 2026 Market Report

The reset is largely done
Six months of pricing across 52,147 fine wines tell one story: the long repricing of fine wine has run out of downward momentum. The market found its floor in February, breadth is improving, trade discounts are narrowing and the quality end is already rising. We walk through the evidence.
Table of contents
The market in H1: Four months up
H1 included four consecutive months of price rises, the first such run since the correction began.
We track every wine with a complete monthly price series: 52,147 wines, indexed to December 2025 = 100. Two lines, two questions. The equal-weighted index averages every wine's move and answers “what did the whole market do?” The median line follows the wine in the exact middle of the pack, so a handful of big movers can't drag it, and answers “what did the typical wine do?” The average closed the half up 0.05% while the median eased 0.14%: the market is flat overall, and the recovery so far is carried by a minority of strong risers rather than the typical bottle.
The bottom is forming: Momentum has turned
A bottom shows up in the data before it shows up in headlines. It shows in the month-on-month direction of the index, in the share of wines rising, and in how tightly prices cluster. All three moved the right way in H1.
The traded market: Where wines actually changed hands
Quoted prices are opinions. Trades are facts. So we stress-tested the story: strip the universe down to the 5,393 wines that actually traded in 2026 and re-run everything. The traded market cleared lower than the quoted one, and the honest picture is still a bottom forming. It's also why this report introduces the Cult Liquid 100: an index of the hundred most consistently traded wines, built to track the market's true pulse.
Regions: The rotation has started
Recovery never arrives everywhere at once. It starts where the value case is strongest. In H1 that meant Italy and southern France, while the regions that led the boom are the last to turn.
| Region | Wines | H1 index | Median wine | % rising | Trade pace vs 25 |
|---|---|---|---|---|---|
| Rest of Italy | 545 | +1.93% | +0.51% | 57.6% | +14% |
| Tuscany | 2,259 | +1.52% | +0.09% | 51.8% | -7% |
| Rest of France | 1,157 | +1.50% | 0.00% | 49.4% | -5% |
| Champagne | 1,598 | +0.63% | 0.00% | 47.0% | +23% |
| Rhône | 3,290 | +0.35% | -0.11% | 46.7% | +54% |
| Rest of World | 4,219 | +0.29% | 0.00% | 46.0% | +25% |
| Bordeaux | 7,838 | +0.13% | -0.20% | 46.5% | +10% |
| Burgundy | 24,013 | -0.20% | -0.23% | 44.2% | +24% |
| Piedmont | 3,310 | -0.36% | -0.40% | 42.9% | +11% |
| USA | 3,918 | -0.45% | -0.40% | 42.1% | +20% |
Age & maturity: Time in bottle is being paid for
Group every wine by its age and a clean staircase appears: the older the wine, the better the half. Wines past fifty averaged +2.9% while the youngest vintages fell. Scarcity does what scores can't: old wine only gets scarcer.
What's holding value: Quality found its floor first
Cut the market by quality, price or age and the same pattern repeats: the top of each scale is already rising. That's the classic early-recovery signature: capital returns to the surest names first.
Scores on the doors: Points didn't pay this half
Here's the finding we didn't expect: critic scores ran backwards in H1. The higher the rating, the softer the price: 98–100 point wines fell 0.43% on average while sub-90 point wines gained 0.57%. This isn't the market doubting the critics. It's the cult premium, built in the boom years, still deflating.
Blue chips: Super Tuscans outran the First Growths
The market's two most-watched families went different ways in H1. The five Super Tuscans rose together, every one of them positive. The five First Growths split apart: Lafite led the entire blue-chip field while Latour fell. Owning “the top names” wasn't a strategy this half; owning the right ones was.
| Wine | Vintages | Mean | Median | % rising | Trades 26 |
|---|---|---|---|---|---|
| Lafite Rothschild | 62 | +2.7% | +1.1% | 58% | 185 |
| Mouton Rothschild | 65 | +0.9% | +0.2% | 54% | 189 |
| Margaux | 56 | +0.5% | -0.8% | 36% | 91 |
| Haut-Brion | 64 | +0.1% | -0.8% | 36% | 127 |
| Latour | 53 | -1.4% | -0.9% | 36% | 51 |
| Wine | Vintages | Mean | Median | % rising | Trades 26 |
|---|---|---|---|---|---|
| Solaia | 32 | +6.0% | +1.6% | 63% | 44 |
| Tignanello | 31 | +2.2% | +1.6% | 65% | 205 |
| Ornellaia | 33 | +2.2% | +1.5% | 70% | 95 |
| Sassicaia | 46 | +1.5% | +0.4% | 52% | 169 |
| Masseto | 30 | +0.7% | +1.3% | 60% | 16 |
Producers: Who earned the half
Single wines can be noisy. Producers are the signal. We ranked every producer with at least 20 wines and 10 trades in 2026 (278 qualify) by the median move of their whole range, so one lucky bottle can't top the list and every ranking is backed by real transactions.
Liquidity & trading: The market is clearing again
Price tells you where the market is. Trading tells you whether anyone believes it. In H1, activity ran ahead of last year's pace and the gap between asking prices and traded prices narrowed by a third. Both point the same way: price discovery is working again.
Most traded: Where the liquidity lives
Liquidity concentrates hard in fine wine, and it concentrates in the same places every cycle: Pauillac fifth growths, prestige Champagne, Super Tuscans and First Growths. These are the wines you can always sell. What's new is what the most-traded list says about direction.
Movers & momentum: Where the money went
The biggest confirmed moves of the half: wines above £25 a bottle that traded in both 2025 and 2026, the same liquidity test our Liquid indices use, so every move below is backed by repeat transactions rather than a single print. Beyond the raw moves, we screened for momentum: wines that rose at least five months out of six, and wines whose spring pace beat their winter pace.
The new segments: Letting the data name the market
Run every screen in this report together and the market stops being one blob of 52,147 wines. It resolves into five behavioural segments, each defined purely by the data. We'll track these cohorts from here on; they're the watchlists the recovery will be traded from.
Key findings: What H1 told us
Nine numbers that define the half, and what we think they mean for the second one.
Methodology. All figures derive from our internal pricing dataset of 53,202 wines (12×75cl case prices, GBP), of which 52,147 carry a complete monthly price series from December 2025 to June 2026 and form the index population. Indices are equal-weighted averages of each wine's price relative to December 2025. Trading figures count platform trades; 2026 covers the first half only and is doubled where annualised. Discount figures compare traded prices with quoted market prices; the matched comparison uses only wines that traded in both 2025 and 2026. Movers exclude wines under £25 a bottle and wines not traded in both 2025 and 2026; the momentum screens and behavioural segments apply the same two-year trade test, which also means newly released wines are excluded. Producer rankings require at least 20 wines per producer and 10 trades in 2026 across the range; wine rankings at least 5 vintages per wine and 5 trades in 2026; blue-chip groups use the grand vin only. Age is 2026 minus vintage. Momentum screens count month-on-month rises across the six monthly observations; "spring pace" compares March–June with December–March. Trait analysis compares the share of a trait among the top decile of H1 performers with its share of the whole index population. The Cult Liquid 100 and Liquid 500 are equal-weighted indices of the 100 and 500 wines with the most trades across 2025 and 2026 combined; membership is set by trading volume, never by performance, and will be refreshed each reporting period. Past performance is not a guide to future returns.

Related Articles