Liv-ex Data, Indexes & Indices: Reading the Market
Liv-ex (London International Vintners Exchange) began in London in 2000 with a simple idea, to bring stock-market style clarity to a fragmented wine trade.
Prices, bids, offers and settlement were standardised, and a deep pool of data built up from real trading. That data now underpins the Liv-ex index family used by merchants, funds and the press, including Bloomberg and Reuters, which has become the industry standard for discussing the market.
What Liv-ex prices actually measure
Two price types sit behind most charts and statements:
Mid Price is the midpoint between the highest live bid and the lowest live offer on the Liv-ex exchange, checked against recent transactions and other inputs before publication. It reflects executable trading intent, so it is suited to index construction. Mid Prices are generally available only for wines that are liquid and trade regularly, which fits the index families, because their components are selected from the more liquid end of the market.
Market Price is the best listed selling price for a standard case in the secondary market. It is sourced from wine businesses globally, both on and off the exchange, and is widely used for valuation statements as a guide to replacement cost. Think of it as today’s asking level across the trade, not a matched bid-offer midpoint.
Put simply, Mid Price answers where the market is trading.
Market Price answers what you would likely pay to buy the wine today.
How the indices are built and updated
Liv-ex indices are calculated from Mid Prices only. Frequency varies with breadth.
The Fine Wine 50 refreshes daily because it follows very active Bordeaux wines. Broader baskets such as the Liv-ex 100 and the Liv-ex 1000 are calculated monthly, which suits regions that trade more steadily.
Liv-ex reviews membership and publishes changes quarterly, with a wider annual cycle of vintages, keeping each basket representative of current liquidity.
The benchmarks
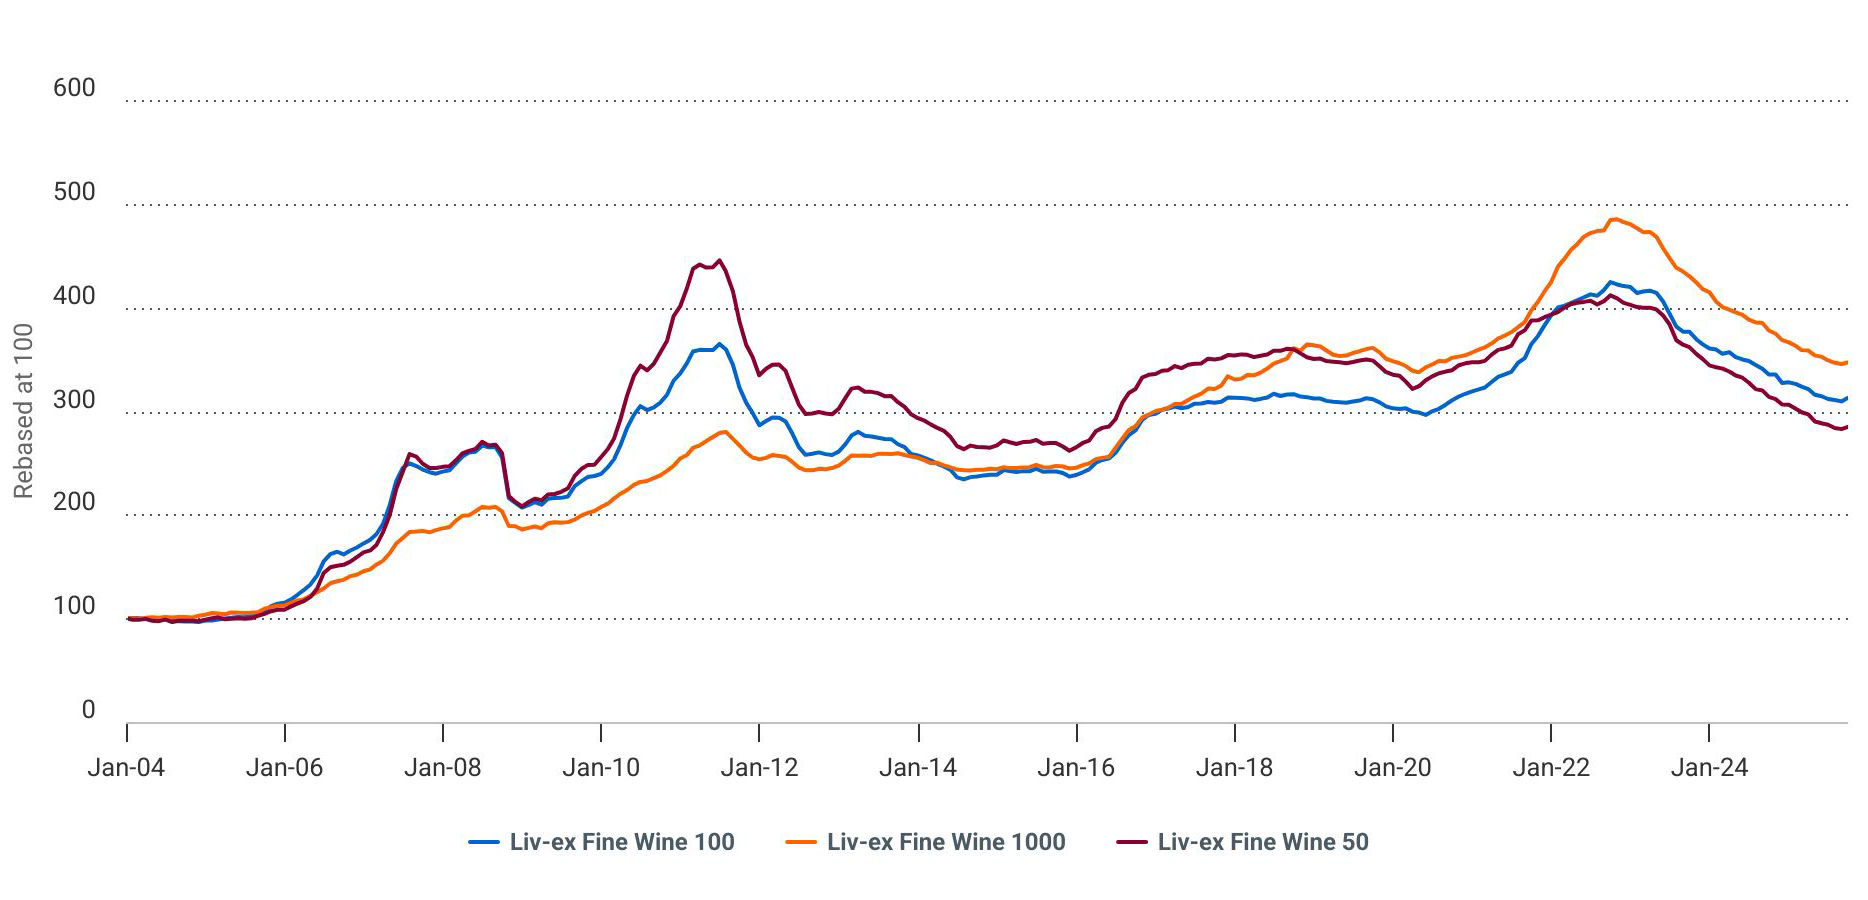
Source: Liv-ex Fine Wine 100, Liv-ex Fine Wine 50, Liv-ex Fine Wine 50 data from December 2003 to September 2025.
These are the names most readers will see quoted:
- Liv-ex Fine Wine 50, the daily barometer of Bordeaux First Growths, built from the ten most recent physical vintages of Lafite Rothschild, Mouton Rothschild, Margaux, Haut-Brion and Latour.
- Liv-ex Fine Wine 100, the industry benchmark, a monthly read across one hundred highly traded wines from leading regions.
- Liv-ex Fine Wine 1000, the broadest measure, also monthly, split into seven sub-indices to show regional trends:
- Bordeaux 500
- Bordeaux Legends 40
- Burgundy 150
- Champagne 50
- Rhône 100
- Italy 100
- Rest of the World 60
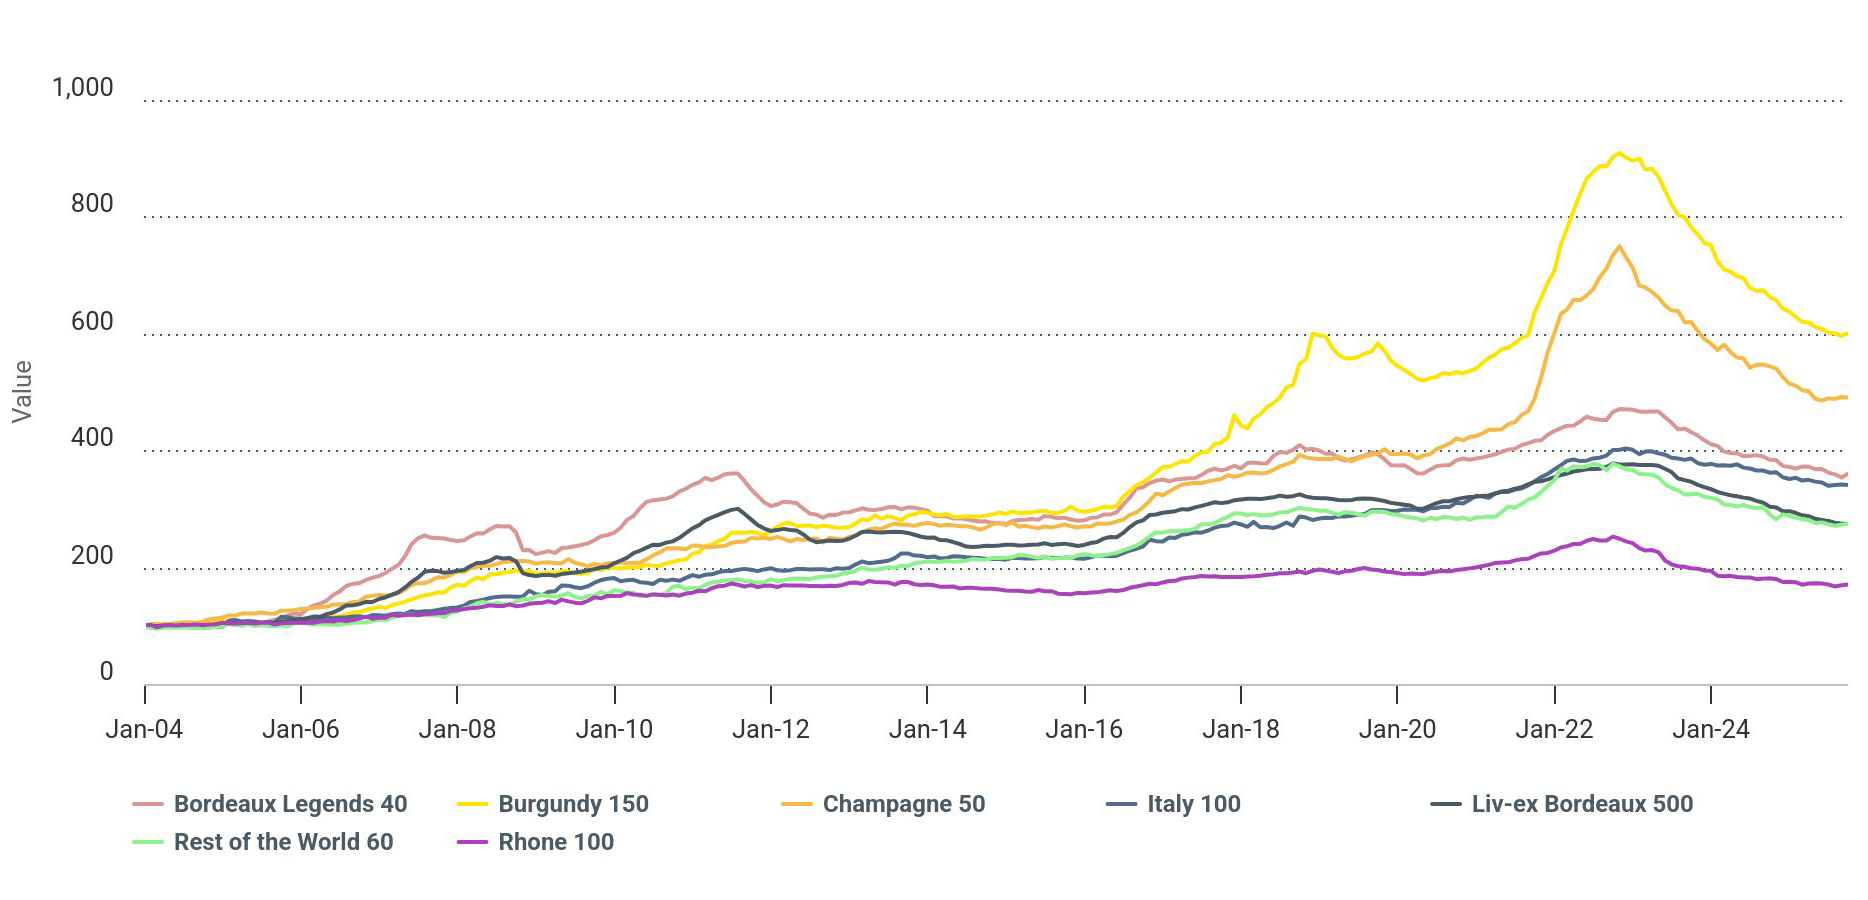
Source: Liv-ex, Bordeaux 500, Bordeaux Legends 40, Burgundy 150, Champagne 50, Rhône 100, Italy 100, Rest of the World 60 data from December 2003 to September 2025.
Those sub-indices have clear scopes. Champagne 50 follows the most recent physical vintages of the most actively traded cuvées. Rhône 100 tracks the ten most recent physical vintages of five Northern and five Southern names. Italy 100 covers the five Super Tuscans alongside five other leading producers on the same rolling-vintage basis. The design keeps comparisons like for like and liquid.
Indices Beyond the Headline Trio
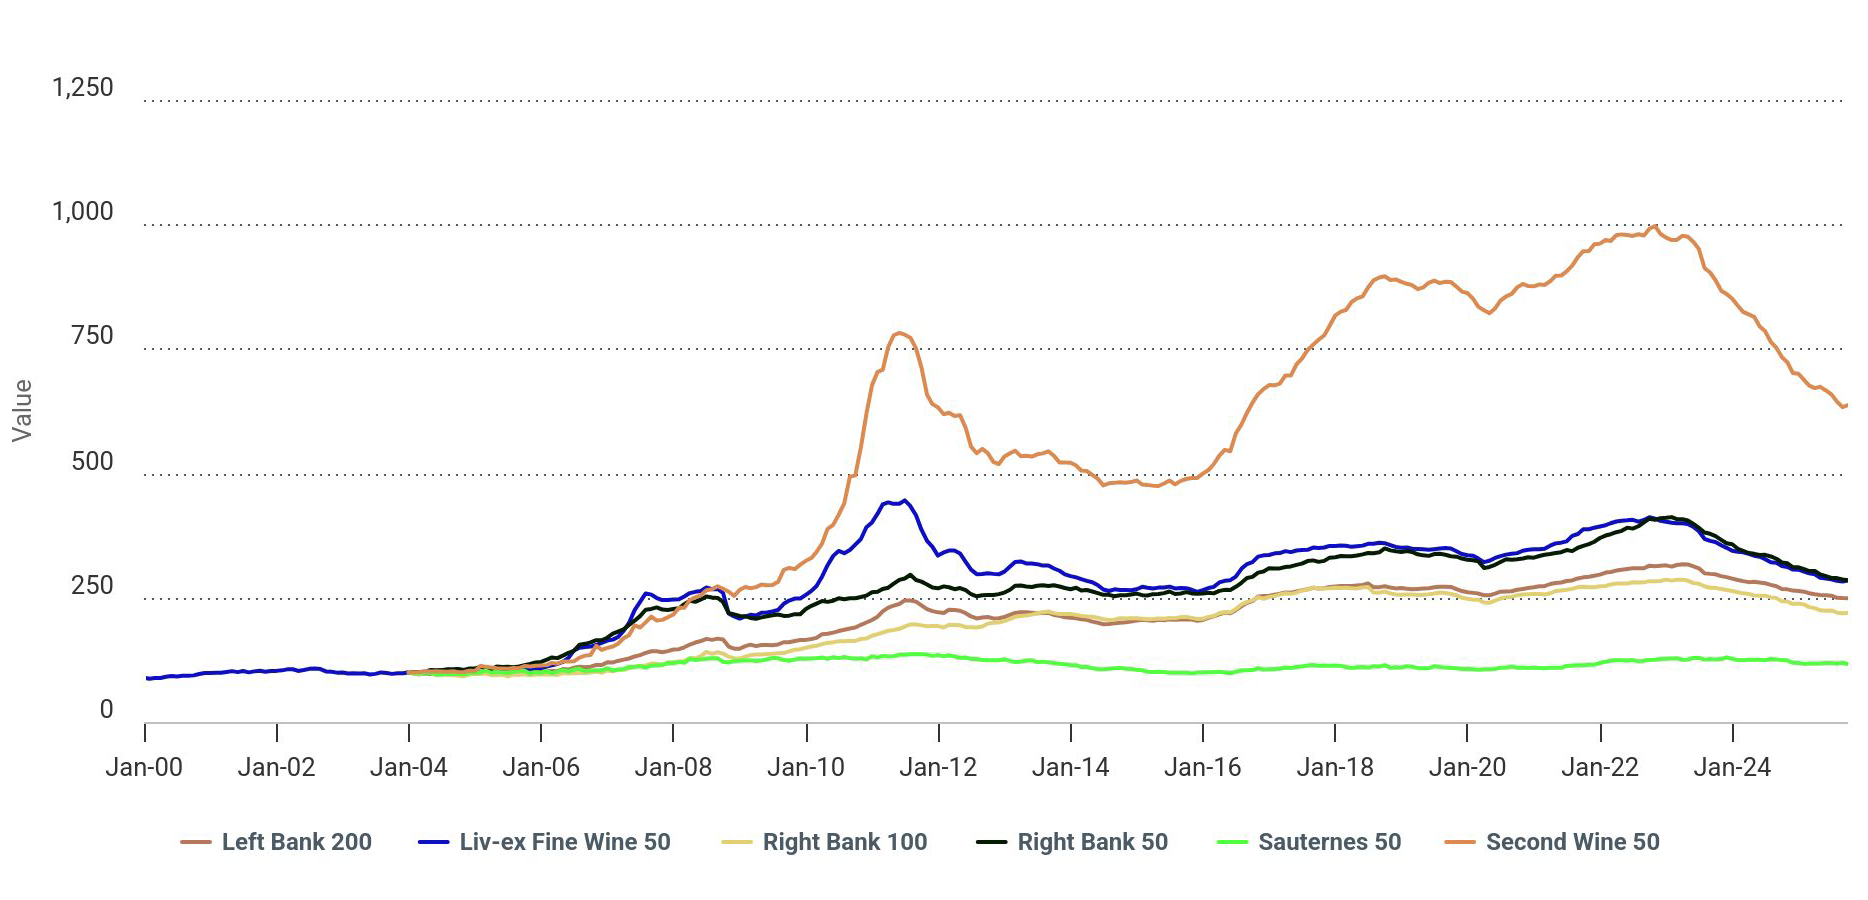
Source: Live-ex, Fine Wine 50, Right Bank 50, Second Wine 50, Sauternes 50, Right Bank 100 and Left Bank 200 data from December 1999 to September 2025.
A richer picture emerges when you look at the specialist cuts Liv-ex maintains alongside the big three.
- Bordeaux 500 sits inside the Liv-ex Fine Wine 1000 and breaks further into six slices, Fine Wine 50, Right Bank 50, Second Wine 50, Sauternes 50, Right Bank 100 and Left Bank 200. These let you compare styles within Bordeaux, from trophy Right Bank labels to the pricing profile of Sauternes and the growing role of second wines.
- California 50 tracks the last ten physical vintages of five flagship Californian wines. It is useful when US names move out of sync with Europe and you want a clean, regional read.
- Port 50 follows the last ten vintages from five leading Port houses. It offers a slower-moving counterpoint to table wines and can help diversify risk.
- Fine Wine Investables is another long-running basket that many fact sheets still reference, giving a narrower, blue-chip view than the Liv-ex Fine Wine 1000.
The more you match your portfolio’s mix to a relevant index, the better your benchmark. Burgundy-heavy holdings will not track the 50 closely. A cellar with Champagne and Italy may map better to the 1000 and its sub-indices. These focused indices also help spot rotation, for example, when California steadies while Burgundy cools, or when second wines hold up better than First Growths. Recent Liv-ex updates often call out such shifts month by month.
Reading the Numbers
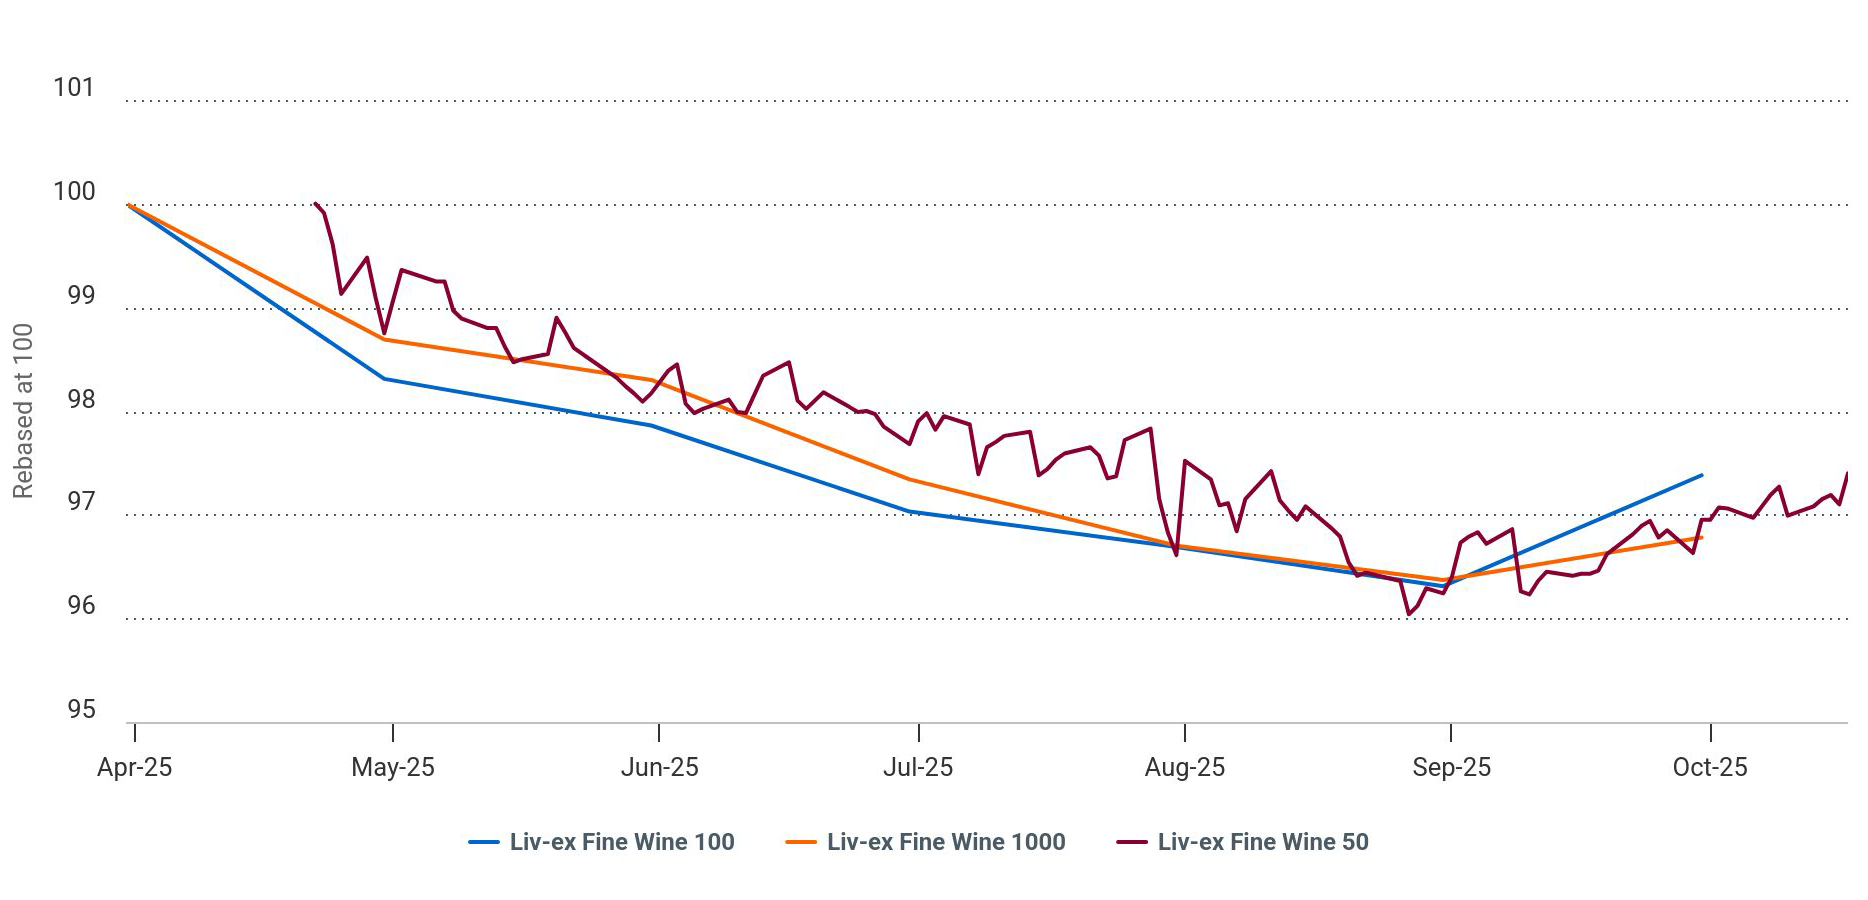
Source: Liv-ex Fine Wine 100, Liv-ex Fine Wine 50, Liv-ex Fine Wine 50 data from March 2025 to October 2025.
When you see “the Liv-ex 50 rose 0.7% in September” you are looking at a daily-based index that summarises very active Bordeaux trading. When you see “the Liv-ex 100 gained 1.1% between August and September”, you are looking at a monthly roll-up across regions that gives a calmer signal.
If your report shows a Market Price per wine and a portfolio total, read that as a replacement-cost lens based on current offers from the trade. Expect realised sale proceeds to differ once market conditions and speed of sale are accounted for.
For performance reporting against an index, the focus is often on the Liv-ex 100 or Liv-ex 1000 series, since these are calculated from Mid Prices and are widely quoted. But in some cases, a regional sub-index can show trends on a more granular level.
The first Liv-ex indices were Bordeaux-centric, reflecting trade flows at the time. As Burgundy, Champagne and Italy grew their share, Liv-ex broadened coverage and formalised the 1000 to capture regional detail in one family. Over the years, Liv-ex has added targeted baskets such as Port 50 and California 50 so analysts can isolate trends that the big composites might blur. That evolution continues as liquidity shifts.
Use the Liv-ex Fine Wine 50 for a quick Bordeaux temperature check, the Liv-ex 100 for a concise monthly read on blue-chip movers, and the Liv-ex 1000 for breadth and regional diagnosis. Add specialist indices such as the Bordeaux 500 and its sub-indices, the California 50, the Port 50, or Fine Wine Investables when you want a closer match to your mix or a clearer view of where momentum is building or fading.
If you are simply exploring whether wine investment might suit you, let the indices do the work. Track the 100 and the 1000 each month to see how stable returns look versus other assets you follow. Dip into the Bordeaux 500 or a regional slice that reflects the styles you enjoy to understand how different segments behave through the cycle.
Read the monthly moves, note any drawdowns, and compare how often each index makes new highs. Even without holding a single bottle, this approach gives you a grounded sense of the market’s rhythm and whether its profile matches your risk appetite.