“Too much of anything is bad, but too much Champagne is just right.” - Mark Twain
Executive Summary
- Over the last 16 years, Champagne investment has been the second-best performing region of the Liv-ex 1000 index, with a total return of +291.5% or CAGR of +8.9% (Compound Annual Growth Rate), behind only Burgundy.
- Extended period of flat prices between mid-2013 and mid-2016 brought market below long-term trend and into strong BUY territory.
- Through a combination of factors, market-share has been steadily increasing.
- CW has been overweight and gradually increasing our exposure over the last three years:
- CW Champagne index (+20.7%) has outperformed Liv-ex’s (+13.3%).
- Champagne plays a defensive role with steady returns and low volatility.
- During the 2008 Financial Crisis, Champagne’s maximum drawdown (maximum observed loss from a peak to a trough) was just -2.5% vs Bordeaux’s -15.0%.
- Prices of back vintages tend to appreciate over time irrespective of vintage variation or quality.
- We recommend an overweight stance with 10-13% exposure towards Champagne.
Performance
Having posted +419% since the start of 2004, only Burgundy has outperformed Champagne’s +291%. Although the two regions were tightly correlated between 2004 and 2017, Burgundy vastly increased the performance gap – no small thanks to the top-tier Domaines’ rocketing prices. Liv-ex’s Champagne 50 maintained its record of low volatility though and while prices have continued positive trajectory, it has been slower, creating an opportunity to exploit.

Cult Wine’s active management has consistently benefited investors as demonstrated by the performance of the CW indices for Burgundy and Champagne when compared to their Liv-ex peers. In the case of Burgundy, as shown in Exhibit 4 of the CW guide to Invest in Burgundy, active management translated into +11.5% of outperformance in 2019. In the case of Champagne, as shown the chart below, active management has meant +2.1% of outperformance per annum over the last 3 years ending in March of 2020.
Cult Wines Champagne Index vs Liv-ex Champagne 50 (3 yrs)
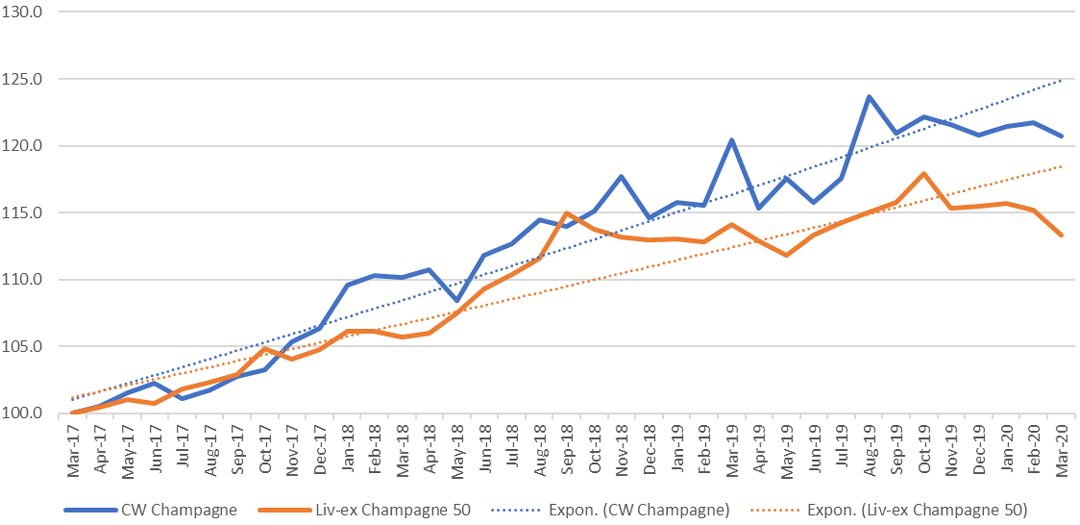
Cult Wines’ average annualised +6.5% over these three years leaves us still below the long-term trend of +9% per annum, putting us in a stronger buyer’s market.
Market Share
Champagne is ‘in’. It’s always been ‘in’ for the UK and US, the two largest exports markets, but now it’s ‘in’ for the less traditional markets, particularly in the East. Hong Kong, China and Japan, export value increased by 14%, 12% and 4% respectively between 2018 and 2019.
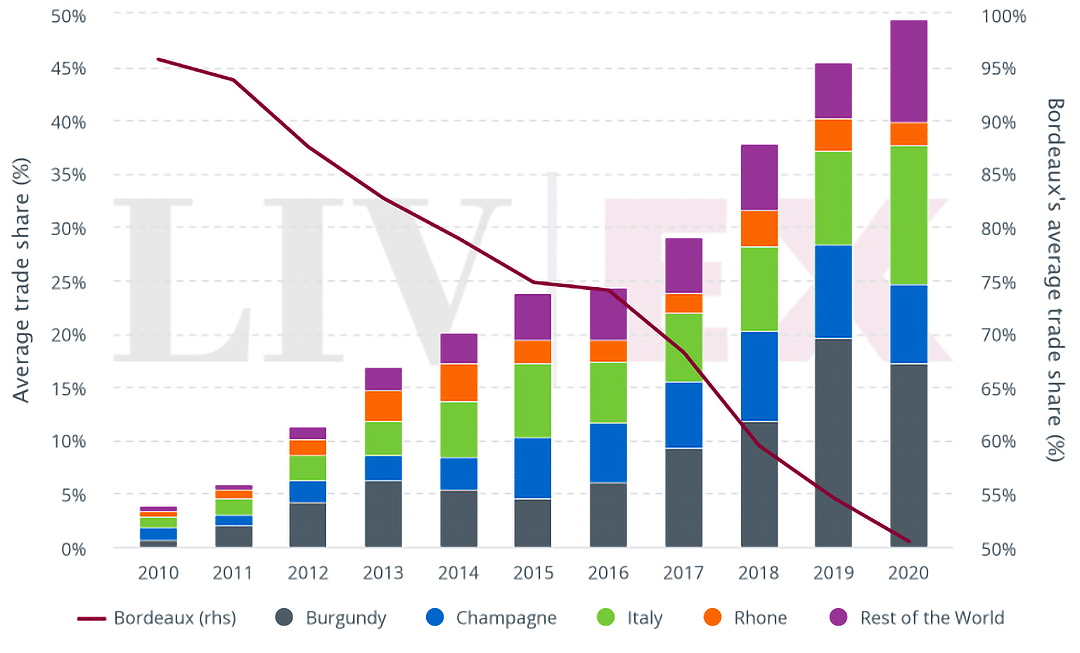
Over the last 10 years, Champagne has increased its market share on Liv-ex from 1% to around 7%. Cult Wines’ level of exposure has always been slightly higher though, currently representing 10% of our Strategic Allocation (long-term objective) and 13% of our Strategic Allocation (short-term opportunities).
Liv-ex Regional Market Share
Supply & Demand
On one side of the coin, we see that Champagne has higher average production levels than any other ‘investment-grade’ wine region, so supply is initially far from scarce. The other side of the coin shows us that demand is massive, global and generally less cyclical.
So although access to stock at first release tends to be relatively easy for the major Champagne Houses (not for Grower Champagnes), this is soaked up quickly as conventional wisdom leads buyers to consume vintages relatively young rather than laying them down for several years.
Conventional wisdom can still be wrong, as those who have the fortune of drinking 20+ year old Champagne will understand, but it works in our favour. The bulk of the population’s experience is with non-vintage Champagne, rather than those you’d consider investing in and to the less initiated, 2002-2008 might seem old for a sparkling wine. This is not the case with vintage Champagne, illustrated by the Wine Advocate’s recommended drinking windows here:
Champagne Drinking Windows
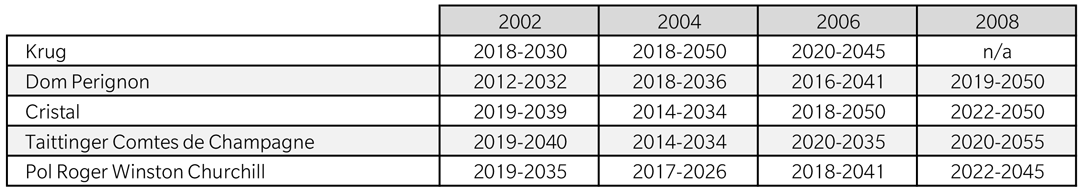
Of the 19 unique wines from these four superior vintages, 12 of them enter their recommended drinking windows between 2018 and 2020 suggesting to us that supply will begin to drastically decrease for these vintages over the next few years. By comparison, the 2000 vintage has a much earlier average start to its drinking window: 2012.
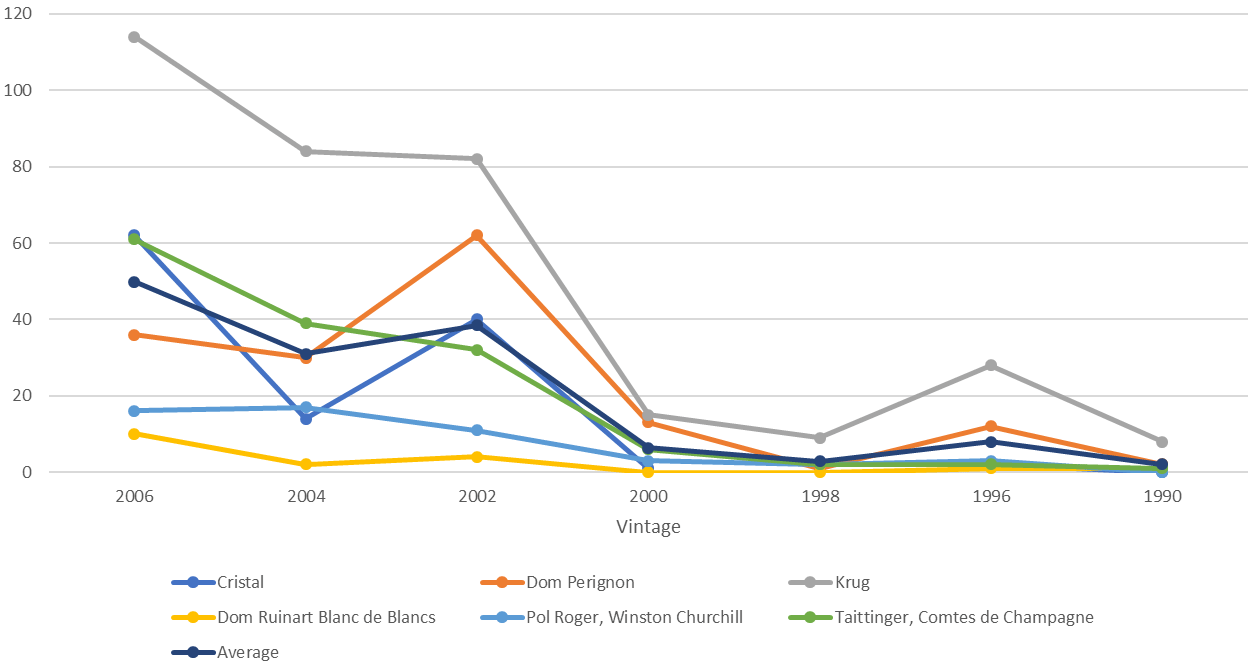
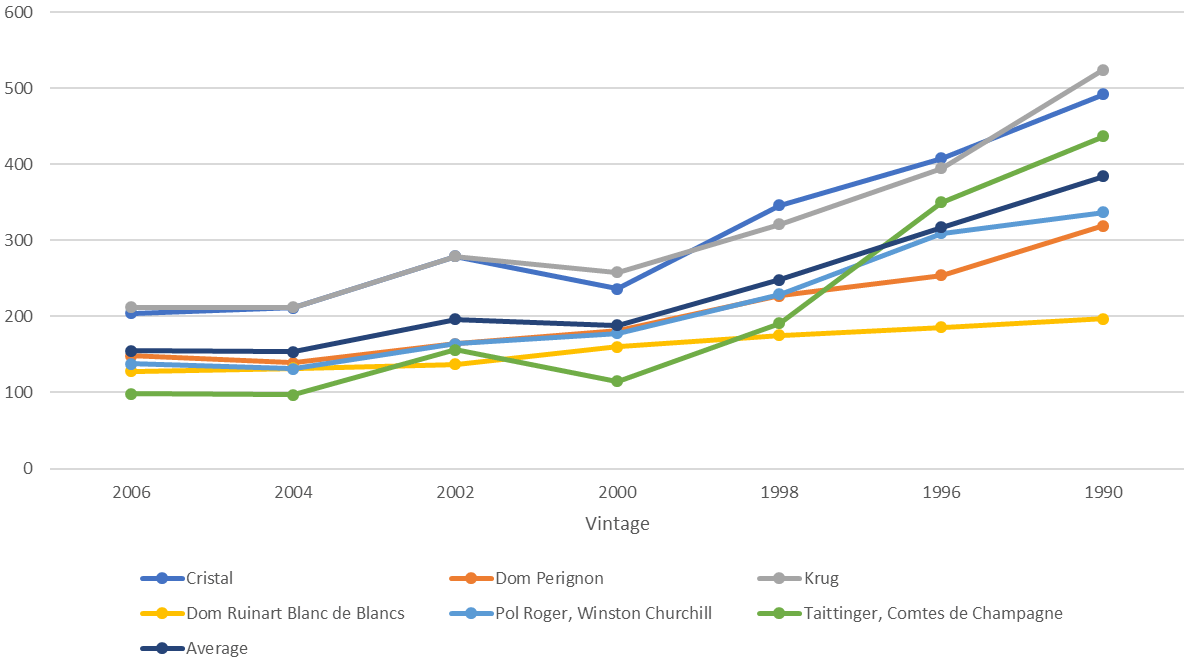
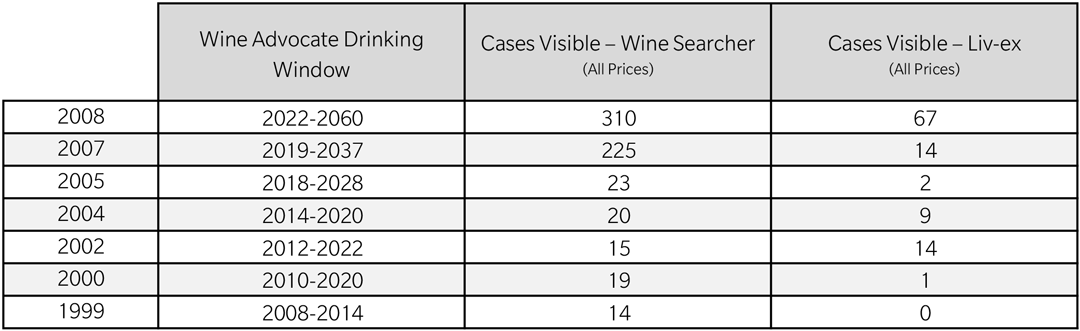
Broadening the sample to six leading Champagne houses over seven prime vintages, we can quickly see that these vintages are approaching the stage where the lack of availability will have a positive impact on prices.
Cases Visible on Liv-ex
Average Bottle Price in Wine Searcher
Case Study – Bollinger Grande Année 2008
To each House, we apply a bespoke methodology and while there are those where vintage quality is the main driving factor (see our article in Robb Report on Dom Perignon Vintage 2008), it is more common for Champagnes to appreciate irrespective of overall quality, instead motivated by the supply/demand imbalance highlighted above.
Let’s take a quick look together at some key figures for Bollinger’s La Grande Annee 2008, one of the undeniable stars of the vintage.
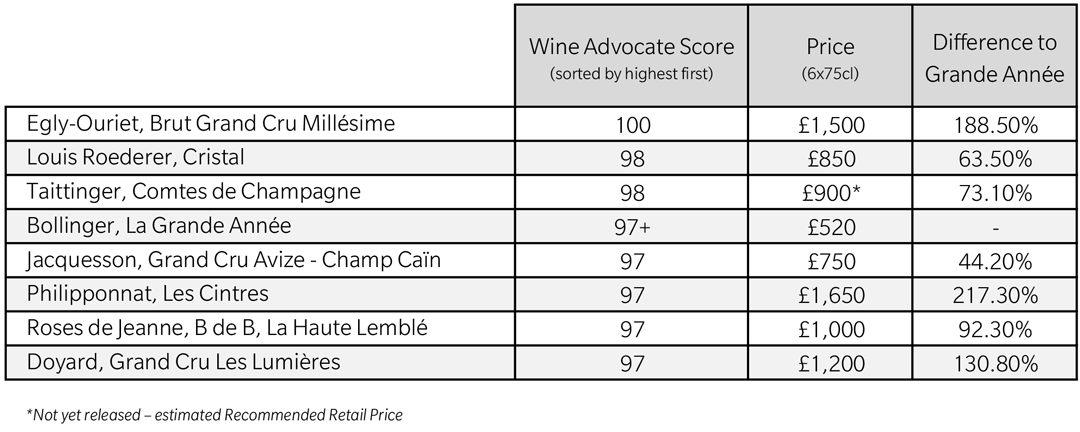
1) Value vs other leading 2008 (white) Champagnes
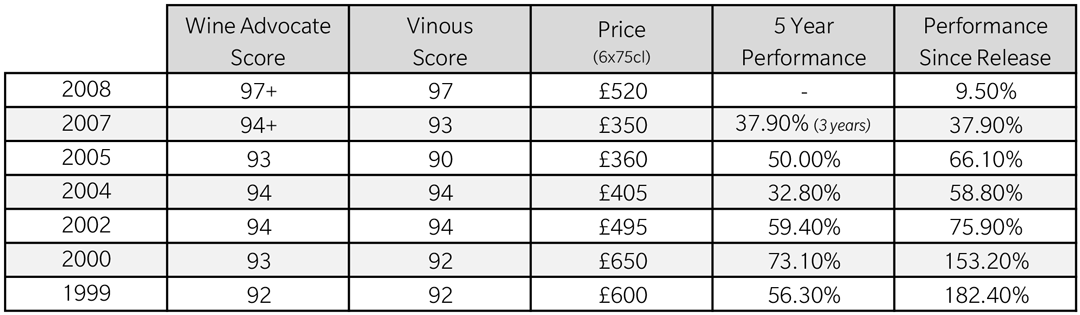
2) Value vs other vintages of the same Champagne
3) Availability in the marketplace
Key Points
- £520 per 6x75cl
- Fourth highest ranked white Champagne by The Wine Advocate for the 2008 vintage
- The vintage itself scored 99 from the publication, the highest ever score received for the region
- The closest competitors (Houses rather than Growers – Cristal, Taittinger & Pol Roger) are on average 64.4% more expensive in the same vintage
- Prices do not benchmark strongly against previous vintages of La Grande Année, however, the 2008 is clearly leagues ahead, so this comparison loses weight
- High availability in the market today but it’s evident that supply quickly decreases once it reaches its drinking window
- Mature vintages have an average CAGR (Compound Annual Growth Rate) of +9.1%
- There appears to be low correlation between the vintage quality and the returns
View
The 2008 appears expensive versus other vintages of La Grande Année and considering there is little evidence to suggest that this particular Champagne’s growth figures are driven primarily by quality. One could argue that it might remain static until supply has decreased further. The 2007 seems to be in a stronger ‘striking position’ at its current price vs availability.
However, what we can’t track so easily is the global secondary market and sentiment for La Grande Année, particularly in emerging markets where there remains a heavy sway towards brand/vintage buying over purely seeking value.
In balance, La Grande Année 2008 is such a sublime and stand out wine that it’s more appropriate to take it in the context of the vintage rather than the producer. And here, it ticks the boxes for brand, vintage and value, all at the same time. So, the 2008 looks like one of the most attractive long-term, safe bets from Champagne today.